3.4. Recurrent Neural Network (RNN) In Practice - Predicting Stock Prices
This article continues from 3.2. Recurrent Neural Network (RNN) Theory (Basic). If you have not read that one yet, it is recommended that you start there.
3.4.1. Preparation
Please run the following command in your terminal to install the required packages:
pip install keras tensorflow pandas
This article uses my csv file, which I uploaded to GitHub. Click the link to view and download it.
It contains two columns of information: one column is Time, representing time points from 1 to 700, for a total of 700 points; one column is Value, representing the stock price.
Just place the downloaded data in your Python project.
3.4.2. Model Details
Before we start coding, let’s first settle a few model details:
- A single-layer RNN with 5 neurons in the output, and then one final output determined from the values of those 5 neurons
- Use the first eight data points each time to predict the ninth data point
3.4.3. Coding It Up
Step 1: Read the Data
Use the pandas library to read the data and assign variables at the same time:
# Load the data
import pandas as pd
data = pd.read_csv('simulated_stock_data.csv')

prices = data.loc[:, 'Value']
times = data.loc[:, 'Time']
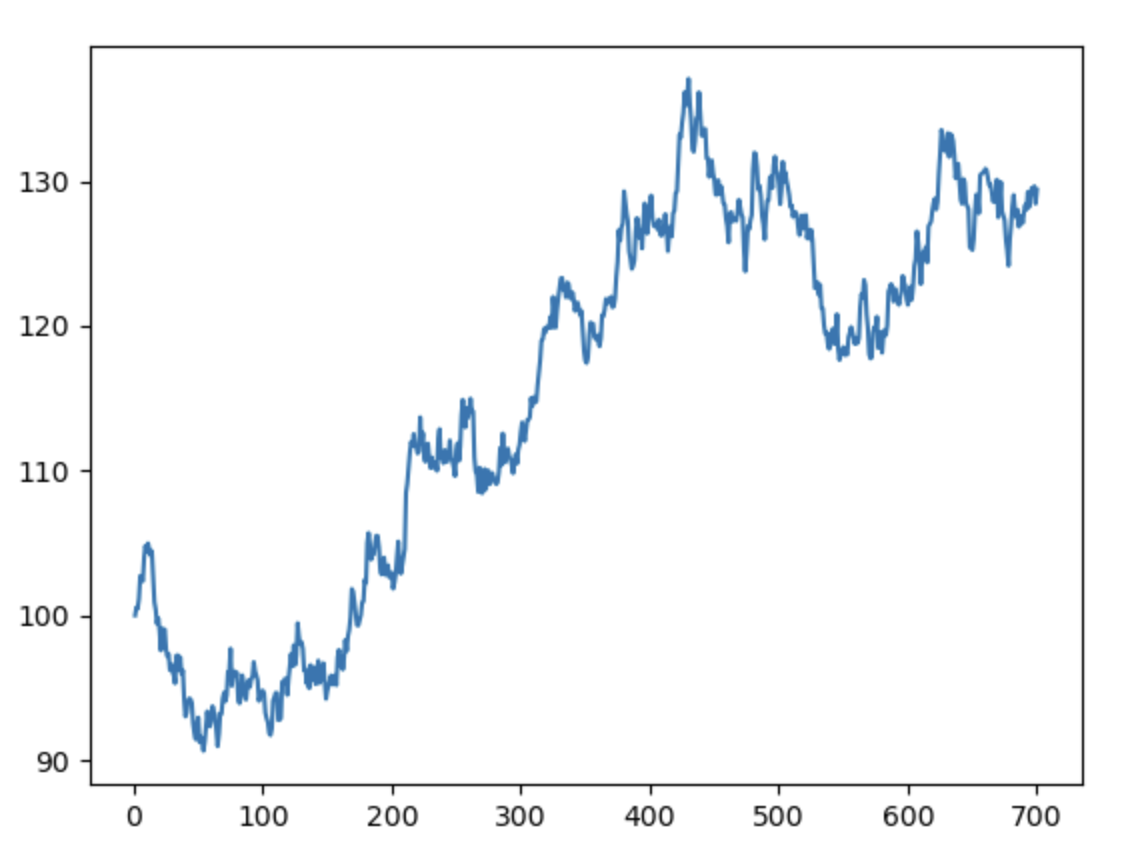
Then use matplotlib to plot the raw data:
# Visualize the raw data
import matplotlib.pyplot as plt
plt.plot(times, prices)
plt.show()
Image output:
Step 2: Normalize the Data
From the plot above, we can see that our data ranges from around 90 to around 130. The gap is too large, and it is easy to end up with a situation like a steep bowl with a flat bottom. To avoid this, we normalize the data by dividing by the maximum price, so values fall in $(0, 1]$ and gradient descent sees a smoother contour.
# Normalize the data
price_norm = prices / max(prices)
Step 3: Extract X and y
As mentioned above, we use the first eight data points to predict the ninth point, so we need to extract the sequence data first. Every eight data points form a group, and these groups are stacked into a 2D array:
# Extract X and y
import numpy as np
def extract_xy(data, time_step):
    X, y = [], []
    for i in range(len(data) - time_step):
        X.append([a for a in data[i: i + time_step]])
        y.append(data[i + time_step])
    X = np.array(X)
    X = np.reshape(X, (X.shape[0], X.shape[1], 1))
    return X, y

time_step = 8
X, y = extract_xy(price_norm, time_step)
-
time_stepindicates how many consecutive data points are used as one input group to predict the next point. Heretime_step = 8, so each input contains 8 values. -
The loop runs from
0tolen(data) - time_stepto ensure it stays within array bounds. In each iteration:data[i: i + time_step]extracts the consecutivetime_stepdata points starting at positioni(that is, 8 points) and stores them inXdata[i + time_step]extracts the value at positioni + time_stepas the target and stores it iny- For example: if
data = [1, 2, 3, 4, 5, 6, 7, 8, 9]andtime_step = 3, after running the loop we getX = [[1, 2, 3], [2, 3, 4], [3, 4, 5], [4, 5, 6], [5, 6, 7], [6, 7, 8]]andy = [4, 5, 6, 7, 8, 9]
-
Finally, we use NumPy to reshape
X:- For
X, reshape it to(samples, time_step, 1). Each sample represents a group oftime_stepvalues, and we add an extra dimension for the deep-learning model input, representing the number of features, which is 1 here - For
y, keep it as a one-dimensional sequence of lengthsamples(one target per input window). Keras accepts this format for a single regression output
- For
Step 4: Build and Configure the Model
Now we can build the RNN model. Remember to follow the requirements above: a single-layer RNN, 5 neurons in the output, and then one final output determined from the values of those 5 neurons:
# Build the model
from tensorflow.keras.models import Sequential
from tensorflow.keras.layers import Dense, SimpleRNN

model = Sequential()
model.add(SimpleRNN(units=5, input_shape=(time_step, 1), activation='relu'))
model.add(Dense(units=1, activation='linear'))
model.compile(loss='mean_squared_error', optimizer='adam')
model.summary()
-
SimpleRNN layer:
units=5: defines the output dimension of the RNN as 5, which is the size of the hidden state in this layerinput_shape=(time_step, 1):time_step=8(defined in the previous code): indicates that the input has 8 time steps1: indicates that the dimensionality of each time step is 1, because the normalized input is a scalar stock-price value and has only one column
activation='relu': uses the ReLU activation function to encourage nonlinear modeling
-
Dense layer:
units=1: defines the output dimension as 1, used to predict a single price valueactivation='linear': uses a linear activation so that the output is directly a numerical value, in the form of linear regression
-
Compile the model:
loss='mean_squared_error': uses mean squared error as the loss function, which is suitable for regression problemsoptimizer='adam': Adam optimizer, an optimization algorithm that combines momentum and adaptive learning-rate adjustment
-
Print the model architecture:
model.summary()prints a summary of the model structure, including the name of each layer, output dimensions, and parameter counts
Output:
Model: "sequential"
┏━━━━━━━━━━━━━━━━━━━━━━━━━━━━━━━━━┳━━━━━━━━━━━━━━━━━━━━━━━━┳━━━━━━━━━━━━━━━┓
┃ Layer (type)                    ┃ Output Shape           ┃       Param # ┃
┡━━━━━━━━━━━━━━━━━━━━━━━━━━━━━━━━━╇━━━━━━━━━━━━━━━━━━━━━━━━╇━━━━━━━━━━━━━━━┩
│ simple_rnn (SimpleRNN)          │ (None, 5)              │            35 │
├─────────────────────────────────┼────────────────────────┼───────────────┤
│ dense (Dense)                   │ (None, 1)              │             6 │
└─────────────────────────────────┴────────────────────────┴───────────────┘
 Total params: 41 (164.00 B)
 Trainable params: 41 (164.00 B)
 Non-trainable params: 0 (0.00 B)
Step 5: Train the Model
Just feed the data to the model:
# Train the model
model.fit(X, y, epochs=200, batch_size=32)
Step 6: Training-Set Predictions
Finally, let’s look at the model’s predictions and overlay them on the original data to see how large the difference is:
# Training-set prediction
y_train_predict = model.predict(X) * max(prices)
y_train = [i*max(prices) for i in y]

import matplotlib.pyplot as plt
plt.plot(y_train, label='real_price')
plt.plot(y_train_predict, label='predict_price')
plt.legend()
plt.show()
* max(prices):- converts the predicted values back to their original scale
max(prices)is the maximum value used during normalization, and now it is used to map the prediction results back to the actual price range
Image output:
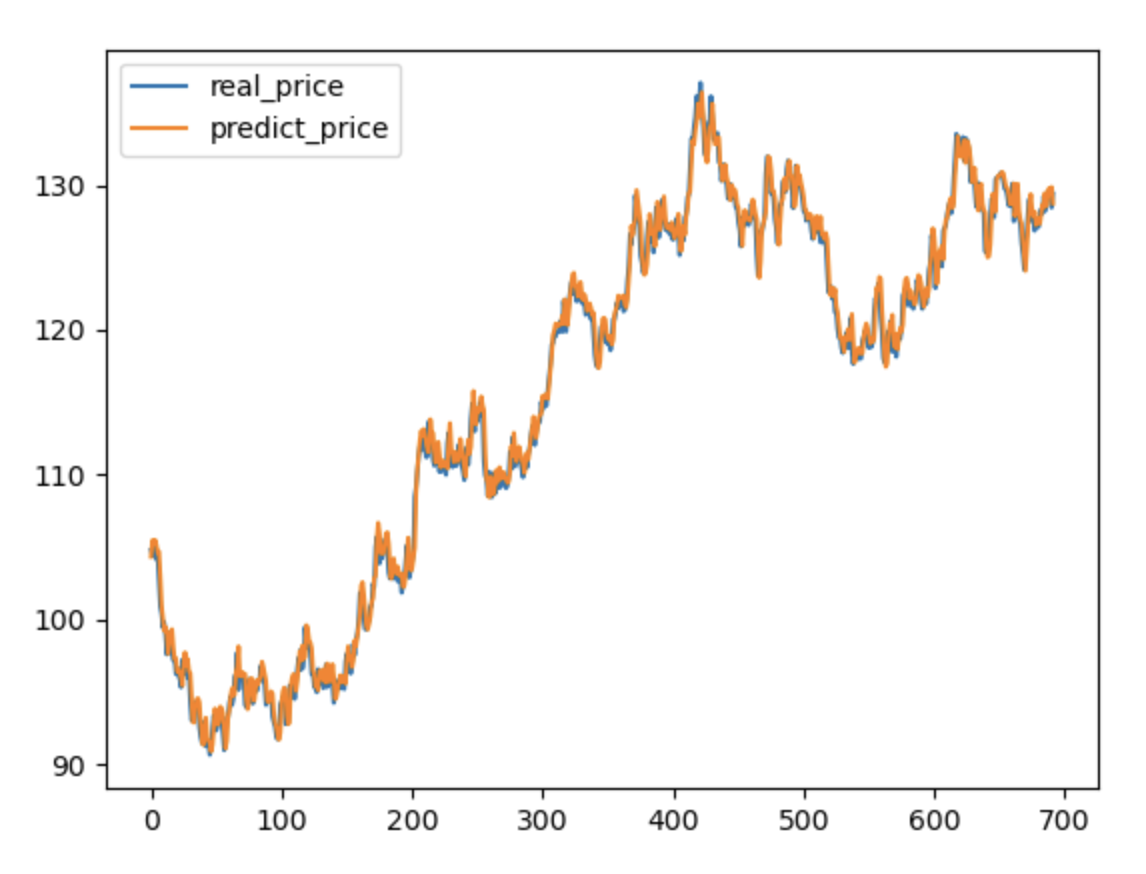
You can see that the result is pretty good, and the gap is not large.